Exploring the Art of the Possible in Power BI
Prototyping advanced geospatial interaction within enterprise BI constraints.
To test the boundaries of Power BI’s native capabilities, we prototyped advanced geospatial interaction patterns focused on zoom behaviour, anomaly highlighting, and operator attention cues.
The Challenge
Heathrow’s BI products were constrained by Power BI’s native visualisation and interaction capabilities. Existing controls lacked the flexibility required for advanced operational dashboards, limiting the ability to highlight critical events, support rich interactivity, and create next generation data experiences.
The challenge was to explore the art of the possible within a fixed time period.
Heathrow’s baggage dashboards were data-rich but cognitively demanding, making it difficult for operational users to quickly identify bottlenecks and pressure points.
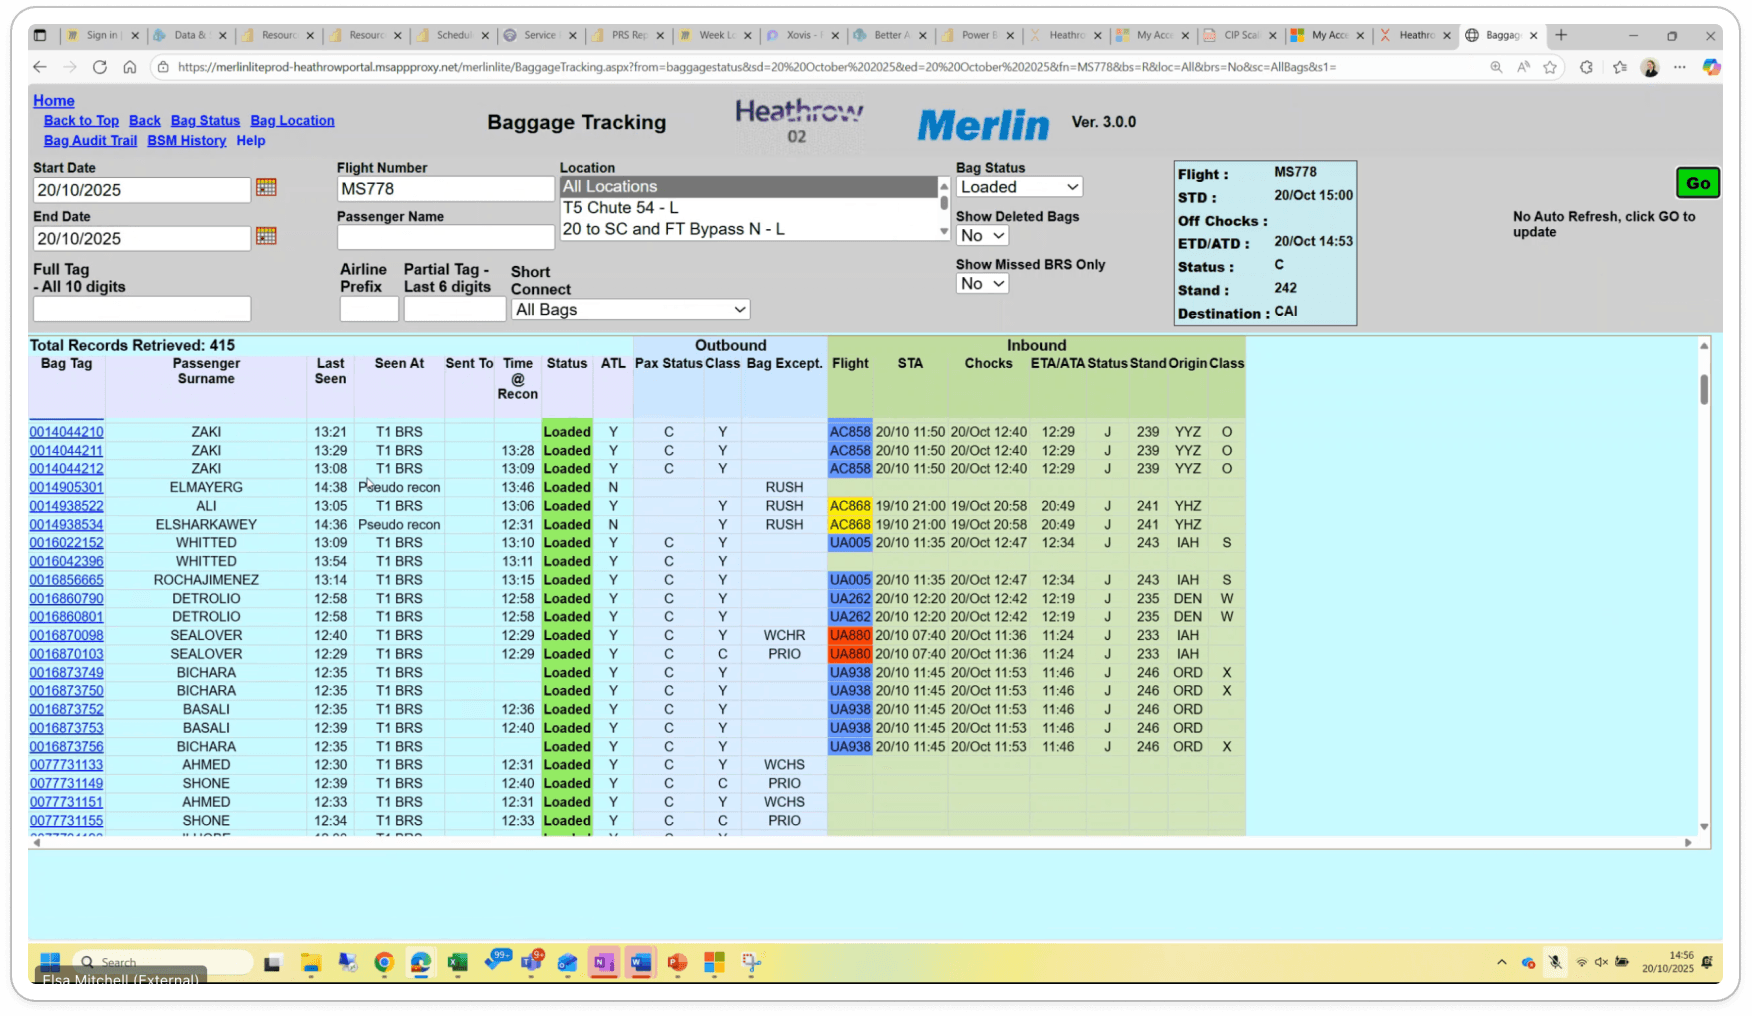
Pre-exploration system revealing cognitive load and limited spatial context for operational decision-making.
Team
Worked within a focused innovation team including a Senior Power BI Engineer, Delivery Manager, and Designer.
The Approach
Art of the Possible Exploration
Investigated Power BI custom visuals to understand the boundaries of performance, integration, and interaction design.
Advanced Interactivity
Explored highlighting, zooming, theming, and list view patterns to support operator attention and anomaly detection.
AI Assisted Design Workflow
Used AI enabled design tools to accelerate experimentation and rapidly prototype advanced geospatial and data driven interfaces.
Before prototyping advanced visuals, we ran focused stakeholder workshops to unpack operational pain points, mental models, and real-world decision contexts.
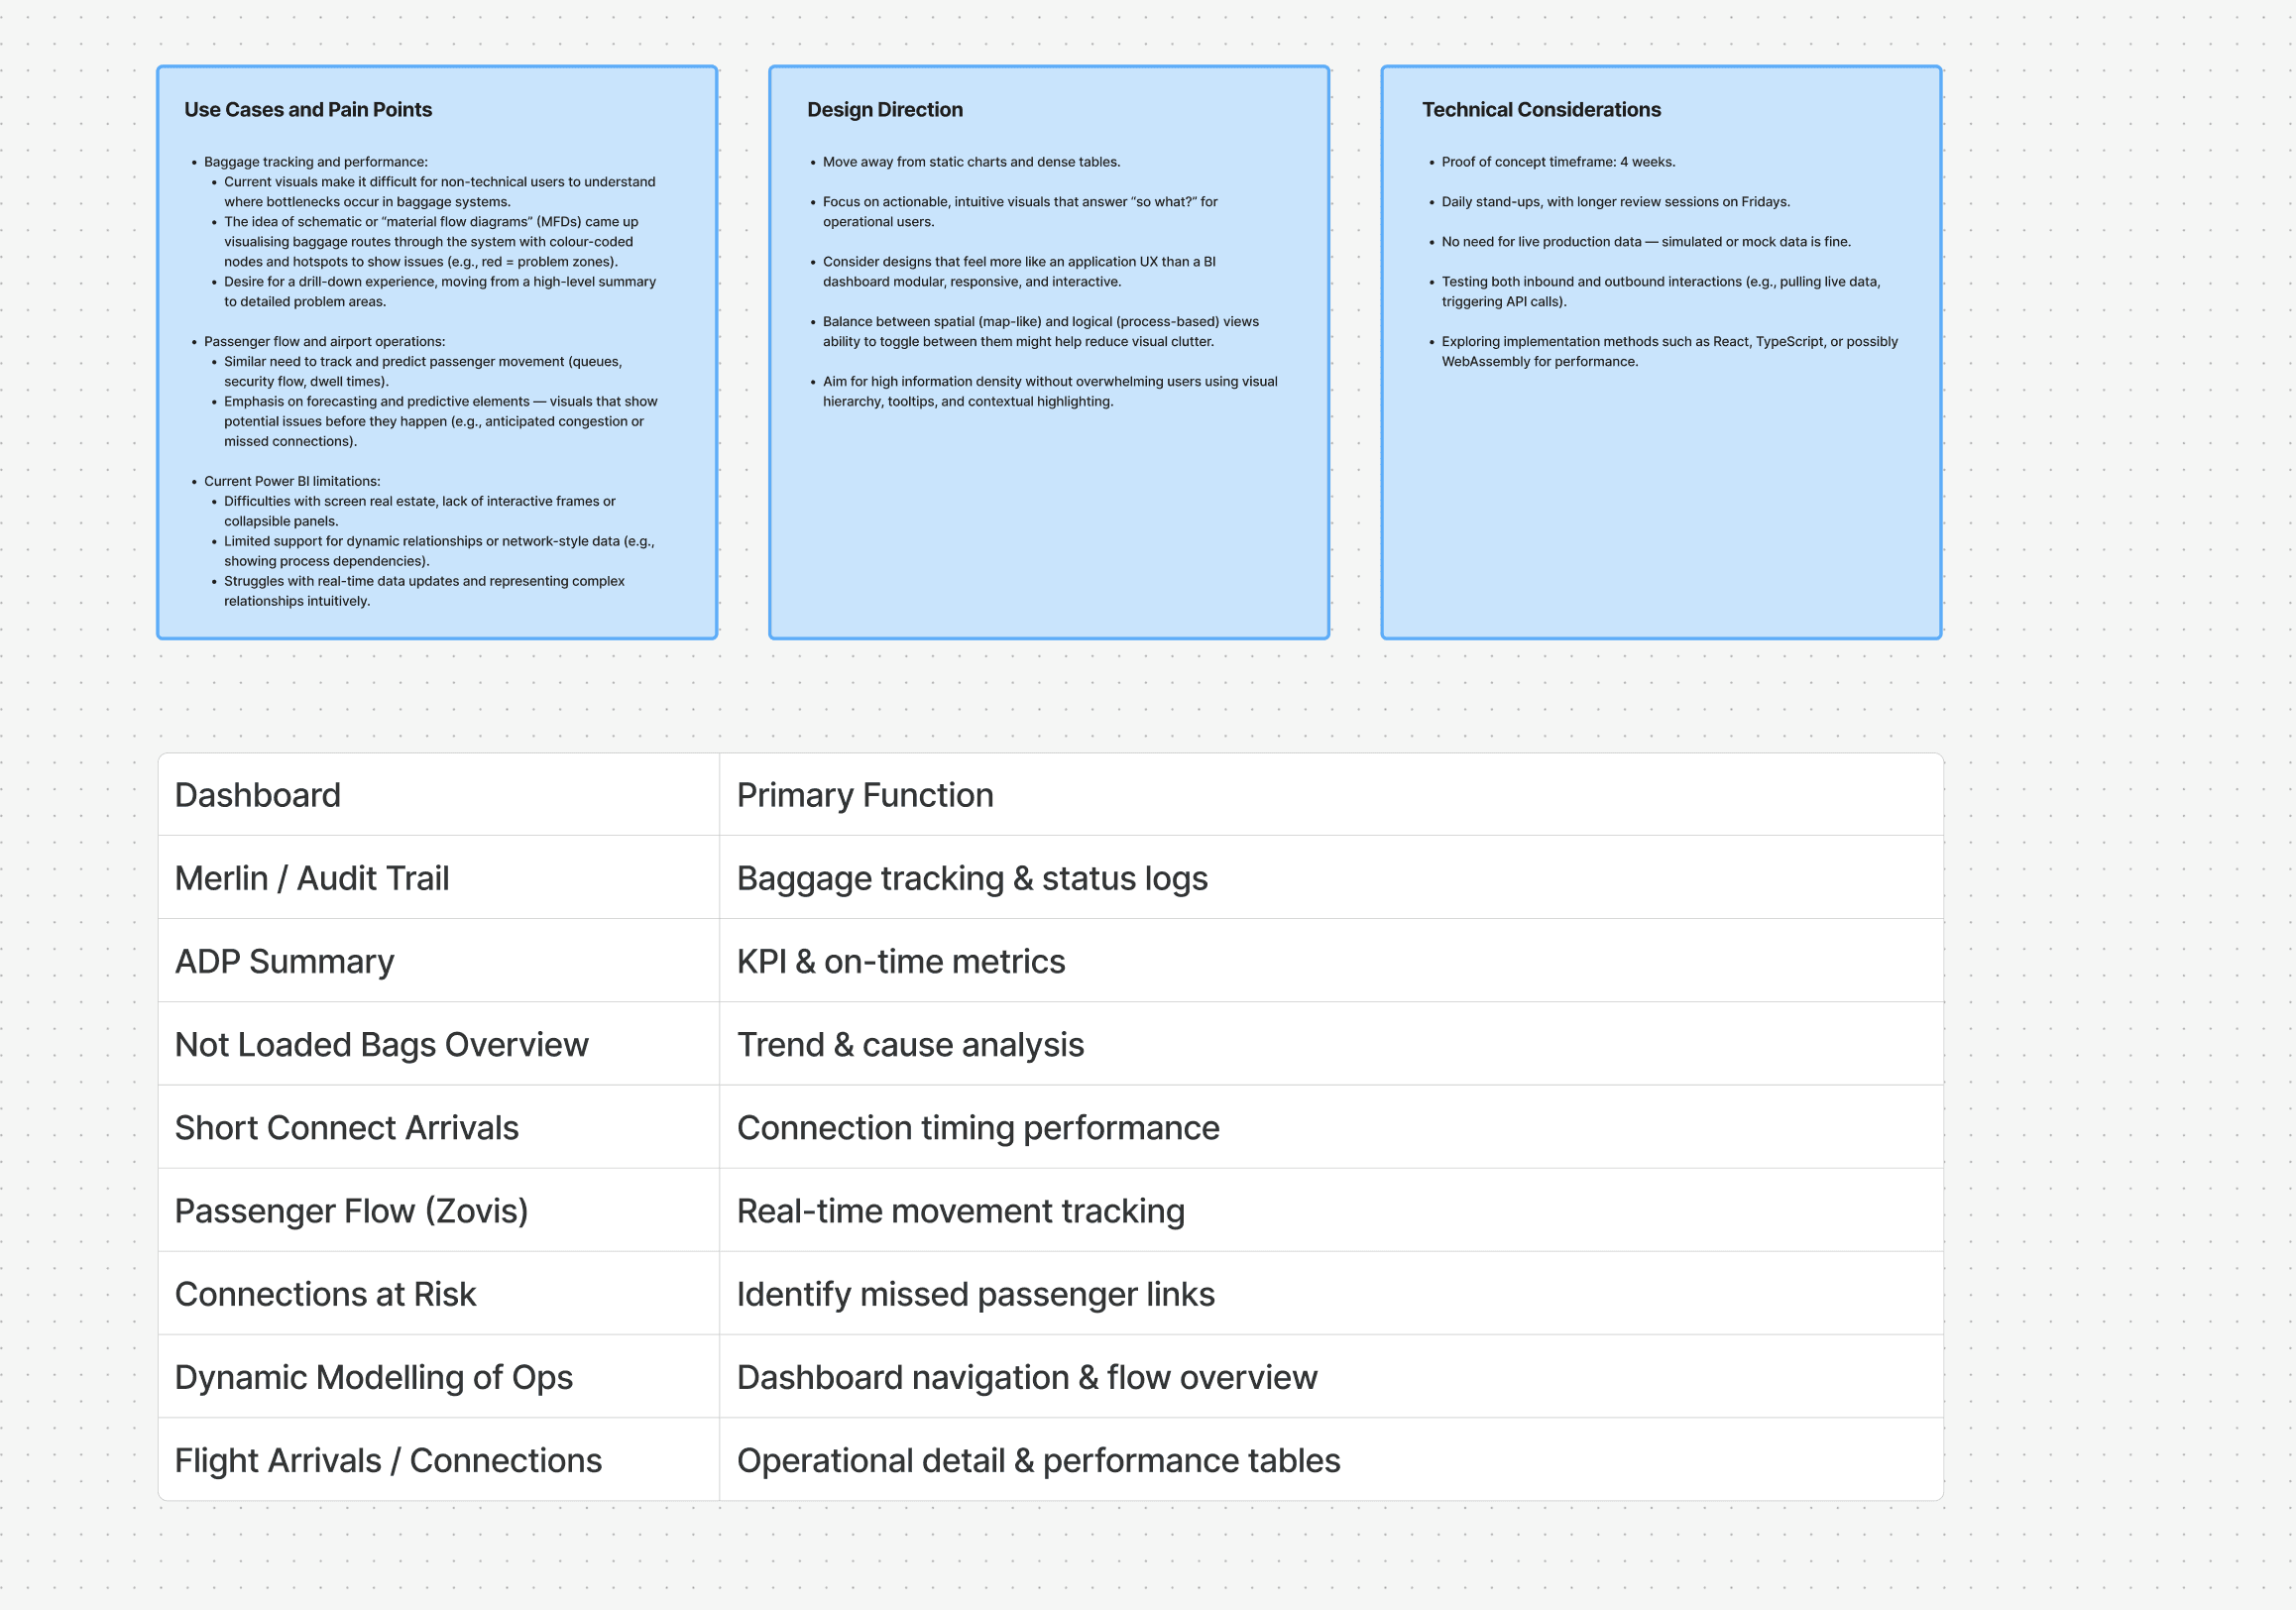
Stakeholder workshop mapping operational use cases, BI limitations, and feasibility constraints.
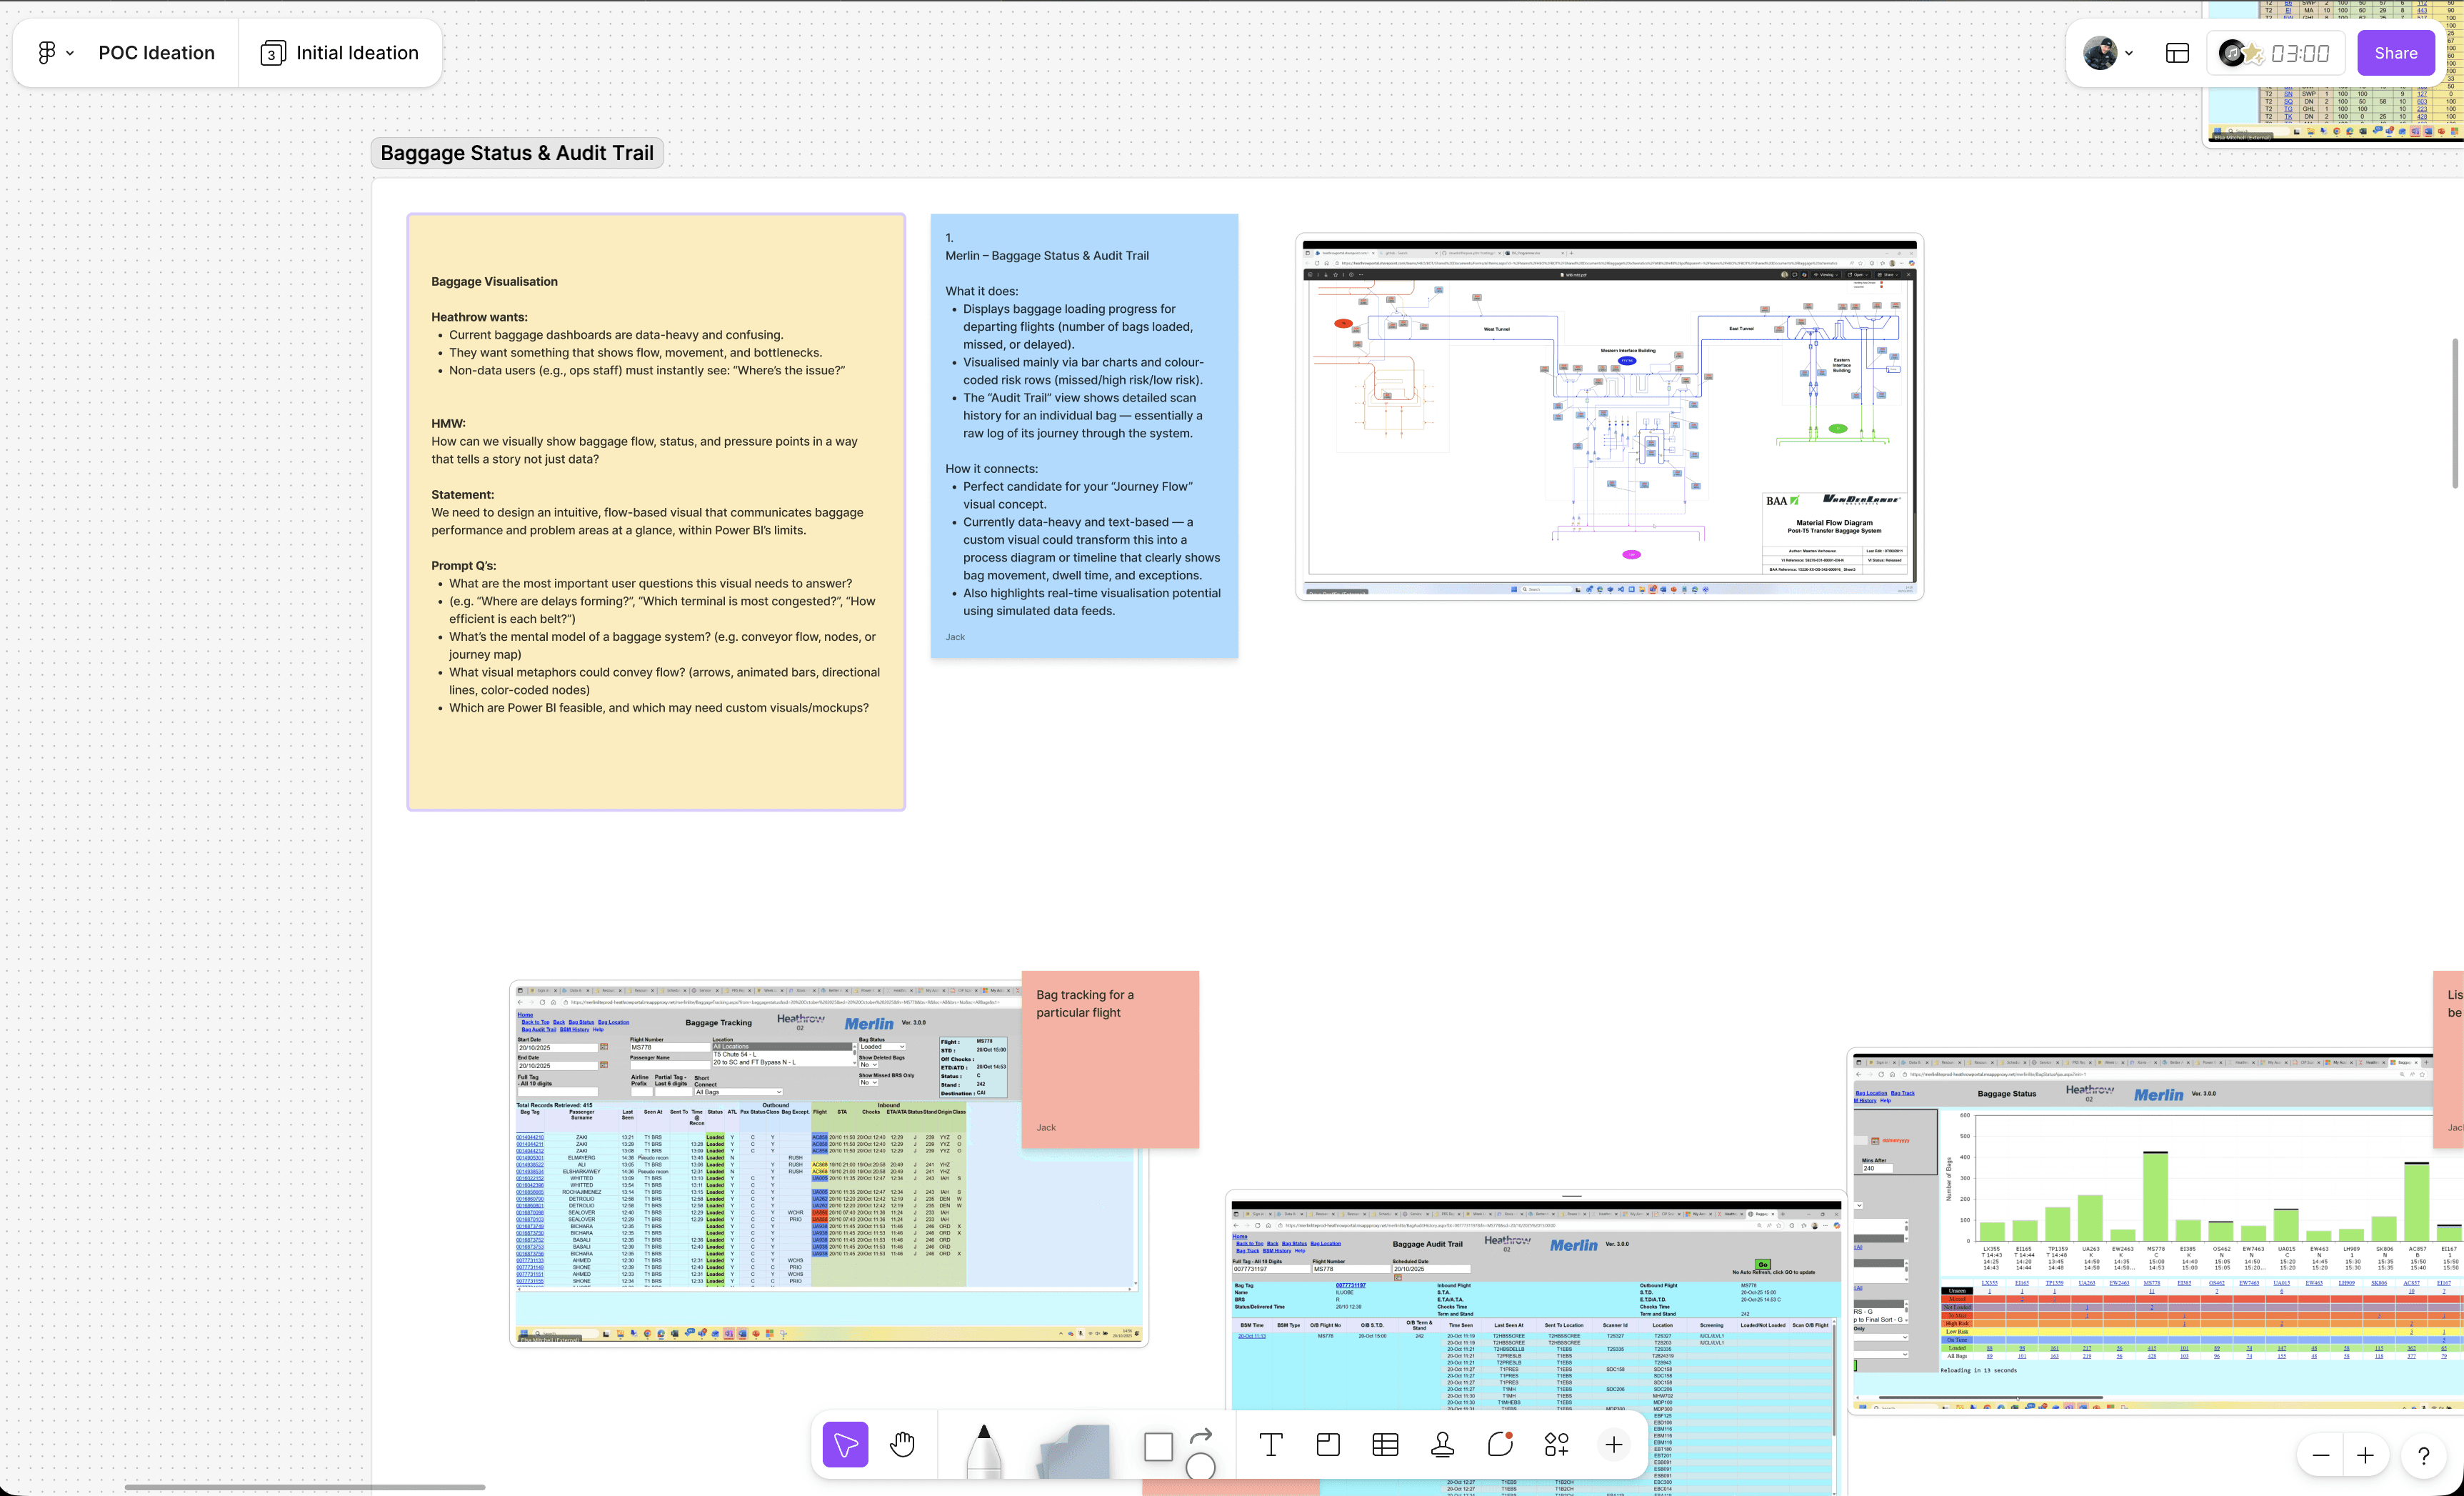
Reframing baggage tracking from static tables to flow-based visual storytelling.
Project Challenges
Platform Constraints
Navigated Power BI’s architectural limitations while pushing beyond default controls.
Time Boxed Innovation
Delivered meaningful exploration and documentation within a fixed engagement window.Performance Boundaries
Tested integration and rendering performance to ensure advanced visuals remained viable within enterprise constraints.
Led the visual exploration of advanced BI interaction patterns
Translated complex operational requirements into a intuitive geospatial interface
Accelerated experimentation using AI assisted design workflows
Alongside the technical exploration, I documented the AI-assisted workflow used to accelerate design experimentation within a fixed engagement window.
Open discussion on using AI-assisted tooling to compress design exploration cycles.
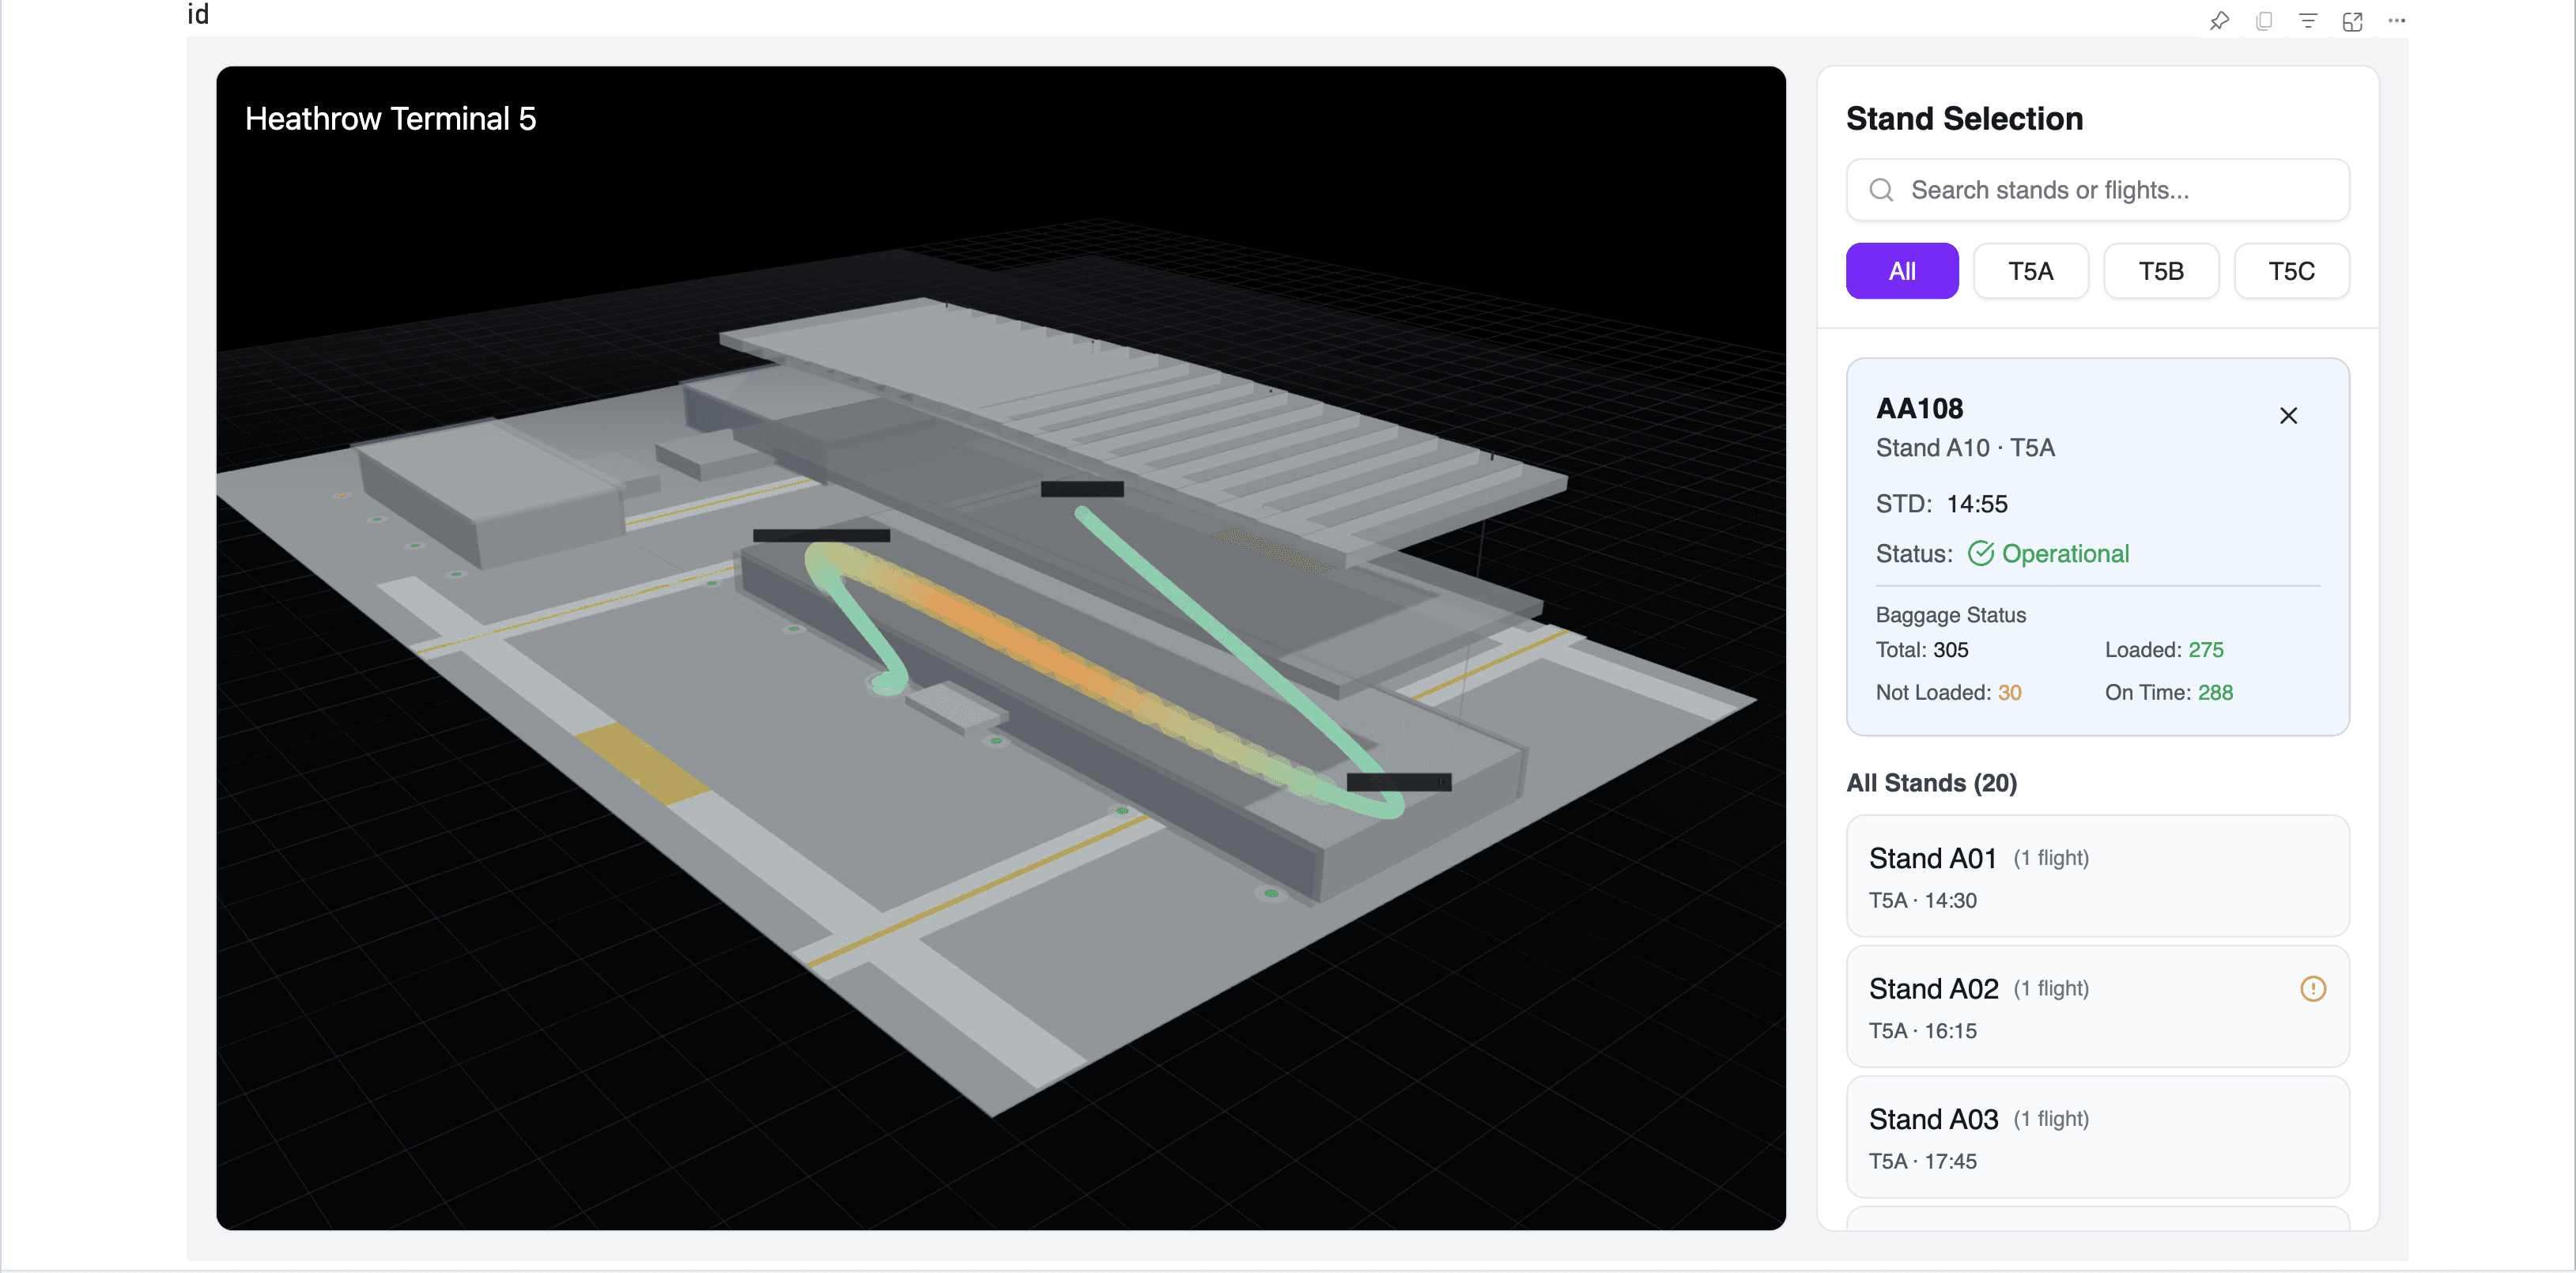
3D geospatial prototype embedded within Power BI, visualising stand level baggage performance in real time.
Outcomes
Demonstrated advanced custom visual capabilities beyond Power BI defaults
Defined interaction patterns for highlighting and anomaly awareness
Provided documented feasibility guidance for future development
Increased confidence in next generation BI product direction
Delivered in partnership with a delivery manager, Power BI engineer, and key stakeholders.